Daily Remarkable news - December 31, 2013 (sources: collection)

USD TOWARDS BEST YEAR SINCE 1979 VERSUS JPY

The dollar hit a five year high against the yen on track and set for the biggest annual increase in comparison with the Japanese currency in 34 years , after rising nearly 21 % in 2013.

The split in the monetary policy of the U.S. and Japan are the main cause for the spectacular performances of the USD against JPY in the year, and can lead to more gains for the greenback in 2014 .

Brighter outlook for the global economy could lead to an increase in foreign investment by Japanese investors , this pressure continues to weigh on the yen , as the currency fell lows over the years with a number of currencies .

Many analysts forecast that Japan's currency will continue to depreciate early next year . However, the VAT hike in Japan in April could make the country's economy and sagging stock price and cause price increases for the yen . However, this currency will decline and the dollar back up to 110 yen at the end of 2014.

GOLD PRICE DOWN TOWARDS THE STRONGEST YEAR IN 3 DECADES

Closed session yesterday , spot gold prices fell 16 cents or 1.4 % decrease , to $ 1.197 / ounce . Trading volume is low due to investors are in the holiday season . Today will be the closing session of the 2013 international gold market . Gold prices are on track to complete five fastest drop since 1981 .

Since the U.S. Federal Reserve ( Fed ) refers to the ability to scale down stimulus because the economy has enough resources to sustainable recovery , many investors have been selling gold to turn to the other assets .

From the beginning of this year , gold prices have dropped approximately 30 % . Many predicted that in the new year 2014 , gold prices continued to be under pressure and can be reached almost 1.050 USD / ounce .

Gold trading strategies of some trusted institutions - December 31, 2013

Gold opened the U.S. session last night dropped to 1204.50 , then hits high in 1209 when the euro rose sharply against the dollar . After U.S. economic data released flourishes , gold prices turned down in 1204 . Quiet trading throughout the day gold prices closed at 1204 .

Kitco - Gold Trading Strategy 12/31

Get up to 24 hours of trend :

To increase slightly sideways Asian session

Walking to the mitigation of Europe

Reducing the U.S. session

The trading range : 1202-1192

Trading strategy :

Sell ​​below 1202 , Stop Loss 1205 , Target 1192 expectations .

ScotiaMocatta - Identify trend gold price 12/31

Gold opened the U.S. session last night dropped to 1204.50 , then hits high in 1209 when the euro rose sharply against the dollar . After U.S. economic data released flourishes , gold prices turned down in 1204 . Quiet trading throughout the day gold prices closed at 1204 .

Thus, the price of gold stopped yesterday to end at 1204 . Metal has gradually moving higher than last week with the direction of travel from the landmark 1188 and ends on Tuesday 6 in 1218 . The support for the important trend is at 1181 and resistance is at 1222 , here is the top of a falling channel in 2 months . In a larger aspect , closed 2013 worth of gold at the lowest point of the minutes from 1181 to the year 1795 . Gold prices also reduce the risk trends .

Forex Yard - Gold Trading Strategy 12/31

Pivot : 1209

Key Strategy : Sell below 1209 target 1187 to 1180

Secondary strategy : If break on 1209 targets for 1219 -1227

Comment : The RSI has attacked the neutral region of 50 % and is reversing down .

The level of technical support

Resistance : 1227 -1219 - 1209

Current Price : 1200.2

Support levels: 1187 - 1180 - 1167

Gold trading strategies of some trusted institutions - December 30, 2013

Last week , gold closed slightly up at 1214 , so this metal has closed alternating up and down in the last 8 weeks . However, the candle fell more platforms , going from 1361 to 1187 . 1180 lows could be tested again .

Forex Yard - Gold Trading Strategy Day 30/12

Pivot : 1202

Key Strategy : Buy on the 1202 targets for 1227 -1245

Secondary strategy : If break below 1202 target return 1187-1167

The level of technical support

Resistance : 1266 -1245 - 1227

Current Price : 1212.8

Support levels: 1102 - 1187 - 1167

ScotiaMocatta - Identify trend gold price date 30/12

Last week , gold closed slightly up at 1214 , so this metal has closed alternating up and down in the last 8 weeks . However, the candle fell more platforms , going from 1361 to 1187 . 1180 lows could be tested again .

Prospects from Elliot wave , we find that the price is in wave C , which is the last in series 3 wave corrective wave from the 1921 level ( the peak in the month of 9/2011 ) . The potential target for wave C is 1155 , according to the Fibo 61.8 % rise from 2008 to 2011 , or 1044 , to the bottom of wave 4 .

RSI is at 35.2 , with support on level 20 , so that gold could continue falling before approaching the oversold territory .

Daily Remarkable news - December 30, 2013 (sources: collection)

EUR / USD highs least 2 years

Common European currency rose to its highest level in the last 2 years against the dollar in the session 27/12 after speaking of the Central Bank of Germany and executive board member of the European Central Bank Jens Weidmann .

Mr. Weidmann said that low inflation is not a reason to loosen monetary policy to keep interest rates low and can cause risks for political reform . EUR / USD rose close range 1:39 , the highest level in the last 2 years . However, the euro fell sharply quickly back then . Experts said that the market has over- reaction to his speech Weidmann .

In an interview on Monday 7 (28 /12) , ECB President Mario Draghi said that despite the crisis in the single currency area in Europe has not ended , but there are positive signs , including the recovery economic recovery in some countries , the trade imbalance has been reduced and the budget deficit has narrowed .

When asked about the issue at cut rates even lower after ECB reduced the base rate to 0:25 % in November , Mr Draghi said : " At this point , we see no need to do that. And we are not worried about deflation . "

GOLD PRICE THIS WEEK : OFFICE ENCLOSED WITH MOLD $ 1.200 / ounce ?

The world gold price increased slightly in the last session of the week from the force supported by physical buying from Asia . According to some analysts , the price of gold will move in a wide range in the next few days and still have the support of the demand in Asian markets , when consumers buy gold ahead of Chinese New Year in late January January .

In the survey of expert opinion on gold price forecast this week by the website Kitco News precious metals performed with 10/17 price forecast rose opinions , comments forecasts 5 discount , and 2 comments valuation sideways. Participation in the weekly poll gold trading companies , investment banks , trading houses and commodity futures expert technical analysis chart .

According to gold traders , the majority of the activities in the international gold market this week , especially before the end of 2013 , will be the profit taking , closing the books of investors . In particular , the buying activity to close the state 's short-selling investors will likely dominate, created to support the gold price . Recently, gold has been strong because short sales tend to decrease continuously .

Mr. Sterling Smith , an expert in commodity futures markets of Citi's Institutional Client Group , said that gold price movements this week will depend on the ability to keep the gold price has been $ 1.200 mold / ounce or not . As long as the gold market maintained a 1,200 USD / ounce , gold is likely to have momentum . But if gold prices fall below 1.200 USD / ounce , the market will sell more than buy .

Daily Remarkable news - December 27, 2013 (sources: collection)

USD / JPY reached almost 105

USD / JPY hit 105 threshold for the first time in more than 5 years as the market expects the central bank of Japan ( BOJ ) will continue the economic stimulus package unmatched in its context of the Federal Reserve U.S. ( Fed ) reduced package of quantitative easing when the U.S. economy recovers.

According to the minutes of the policy meeting published yesterday , the BOJ members expressed concern slowing growth of the Japanese economy by the impact of the tax increase will affect the inflation target of the agency .

The Japanese government decided to raise consumption tax from 5 % to 8 % starting from January 4/2014 and up 10 % in mid- 2015. Action of the tax increase Japanese government is expected to make people temporarily tighten spending .

It is said that Japan 's central bank is likely to further loosen monetary policy by pumping more money into the economy in order to achieve the inflation target . The inflation rate in Japan increased 1.2 % in November , the highest level in the past 5 years , but still far from the BOJ's target of 2% .

Most analysts are predicting that the yen will continue to decline in 2014 and is expected USD / JPY will be hitting 107 in the first quarter and may continue to rise if the BOJ increased regulation 110 scale asset purchase program after the decision of the government to raise taxes .

GOLD MARKET STABILITY OF THE DAY LAST YEAR

In trading yesterday , the world gold market remain stable above 1.200 USD / ounce set two days earlier . Today there are no important economic news is announced , so the market is expected to continue to fluctuate in a narrow range .

Thus, up to this point , gold has established five biggest decline in more than three decades due to strong stock market and expectations of economic recovery threatening global security role shelter full of gold . As a result , compared with the first set prices , gold prices have slipped nearly 30 % and officially ended 12 years of continuous increase chain .

The analysts and investors noted that gold prices will continue to slip in the next year , however , they do not think that gold will re- develop with a script like this year . Accordingly , gold prices may continue to go down in the first year , however , the threshold of 1.050 USD / ounce will be an important support level of this precious metal prices .

Gold trading strategies of some trusted institutions - December 27, 2013

Amount of people applying for unemployment benefits fell by 42,000 arrivals in the U.S. , only 338,000 views in the last week 12/2013 . This week there is not much economic data due for Christmas . Gold prices rose last night due to the unemployment rate fell , while oil prices fluctuated in a narrow range .

KITCO - gold day trading strategy 27/12

Get up to 24 hours of trend :

To increase slightly sideways Asian session

Increase of Europe

Reducing the U.S. session

The trading range : 1214 to 1204 .

Trading strategy :

Sell ​​below 1214 , Stop loss 1217 , Target 1204 expectations .

Forex Yard - Gold Trading Strategy Day 27/12

The level of technical support

Resistance : 1245 -1227 - 1215

Current Price : 1211.2

Support levels: 1180 - 1167 - 1155

Pivot : 1215

The main strategy

Sell ​​below 1215 target for the 1180-1167

Secondary strategy : If break 1215 targets for 1227-1245

Commentary: Evolution longer downward trend if prices do not go beyond 1215 resistance .

NextVIEW - day gold trading strategy 27/12

Of people applying for unemployment benefits fell by 42,000 arrivals in the U.S. , only 338,000 views in the last week 12/2013 . This week there is not much economic data due for Christmas . Gold prices rose last night due to the unemployment rate fell , while oil prices fluctuated in a narrow range .

Gold prices have rebounded and are now fluctuating in the range from 1204.00 to 1215.00 USD / ounce . Forecast gold prices will trade at around $ 1,220.00 / ounce before falling back likely in early May 1/2014 . The support for the end of the year is determined at $ 1,195.00 / ounce .

Gold trading strategies of some trusted institutions - December 24, 2013

Gold dropped to 1202.50 U.S. session open , then increased to the highest level during the day at 1204.50 as U.S. economic data showed personal consumption rose sharply . Finally , the metal turned down when global stock markets climb to a record high , making gold market closed at its lowest level in 1198 version .

Forex Yard - Gold Trading Strategy Day 24/12

The level of technical support

Resistance : 1245 -1227 - 1215

Current Price : 1196.9

Support levels: 1180 - 1167 - 1155

Pivot : 1215

The main strategy :

Sell ​​below 1215 target for the 1180-1167

Secondary strategy : If break 1215 targets for 1227-1245

Comment : The RSI is bearish and falling longer than expected .

Identify trends ScotiaMocatta gold 24/12

Gold dropped to 1202.50 U.S. session open , then increased to the highest level during the day at 1204.50 as U.S. economic data showed personal consumption rose sharply . Finally , the metal turned down when global stock markets climb to a record high , making gold market closed at its lowest level in 1198 version .

Thus, gold has stopped at 1198 . Support is at its lowest level in 1180 with the highest resistance of Thursday 5 weeks ago around 1227 . RSI is at 37.48 with support xuong19.74 reduced compared to the previous low , because gold could fall further before approaching the oversold territory .

Daily Remarkable news - December 24, 2013 (sources: collection)

PROSPECTS OF U.S. $ 2014
At its meeting on 17 - 18/12 , the U.S. Federal Reserve ( Fed ) decision to cut $ 10 billion in quantitative easing ( QE3 ) worth $ 85 billion to $ 75 billion per month . And QE package will likely be reduced after each meeting of Fed policy , the economy improved further .

Speaking at a press conference after the decision , Fed Chairman Ben Bernanke said the Fed is likely to cut $ 10 billion more after each session to . According to the Bloomberg , the Fed will reduce the size of $ 10 billion QE / time at 7 the next meeting and QE program ended in December 12/2014 .


Fed's ability to continue shrinking and terminating easing program in 2014 led analysts believe that USD will continue to rise in the near future. The greenback is expected to maintain the momentum gained sharply against the JPY by ADU and the central banks of Japan and Australia are likely to further loosen monetary policy .

If the eurozone economy continued to show slow recovery next year and inflation of the region remain low , common European currency will decline sharply against the dollar . In contrast , the decline of the euro will be limited.

Meanwhile , the UK economy has shown strong growth in recent years and the unemployment rate fell sharply that the Bank of England to consider raising interest rates sooner than expected . Therefore, the difficult market witnessed sharp appreciation of the USD against GBP .

GOLD PRICE REDUCED DEPTH MAY CONTINUE

The gold market is moving into the quiet session last year with a year of the darkest events in the past 3 decades . Many people believe that gold prices will continue to go down in 2014.

Since the U.S. Federal Reserve ( Fed ) refers to the ability to scale down stimulus because the economy has enough resources to sustainable recovery , many investors have been selling gold to turn to the other assets .

From the beginning of this year , gold prices have dropped approximately 30 % . Many predicted that in the new year 2014 , gold will breach the lows of the month 5/2010 which the threshold is $ 1.050 / ounce .

Daily Remarkable news - December 23, 2013 (sources: collection)

Third quarter GDP GROWTH EXPECTED JOURNEY OF AMERICA

The report released last week by the U.S. Commerce Department showed that U.S. GDP third quarter increased 4.1 % compared to the same period last year , higher than the 3.6 % growth rate given earlier this month and the high growth rate most of the U.S. economy since May 3/2011 .

Strong recovery of the U.S. economy in recent years is the basis for the Fed decided to cut $ 10 billion in quantitative easing ( QE3 ) worth $ 85 billion to $ 75 billion per month . And QE package will likely be reduced after each meeting of Fed policy , the economy improved further .

Speaking at a press conference after the decision , Fed Chairman Ben Bernanke said the Fed is likely to cut $ 10 billion more after each session to . According to the Bloomberg , the Fed will reduce the size of $ 10 billion QE / time at 7 the next meeting and QE program ended in December 12/2014 .

The financial market is not expected to change much this week as most of the major markets entered a long holiday .

GOLD PRICE THIS WEEK : ability to tension

World gold prices surged 1.3 % to $ 1.203 / ounce in trading last week . For the whole week , gold prices fell 2.8 % . According to observers , this rally in gold prices is due to the purchase is the status of short-selling investors and some investors bargain hunting . However, gold still has a week to decide devaluation cut the size of quantitative easing that the Fed launched QE3 on Wednesday .

In session 20/12 , the largest gold trust fund SPDR Gold Trust, the world suddenly bought a net 5.4 tonnes of gold , raised its holdings to 814.2 tonnes . In week 4 of the previous session , funds have been net sellers , with total sales is 18.9 tonnes of gold .

In opinion polls expert predicted gold prices this week by website specializing in precious metals have done Kitco News 8/23 feedback predicted price increase , 11 reviews forecasted prices fell , and 4 the opinion that prices will move sideways. Participation in the weekly poll is gold trading companies , investment banks , commodity traders futures , fund managers , professionals and technical charts .

Analysts said the precious metal broke the psychological level $ 1.200 / ounce in the previous session Thursday , but the bounce back in session Friday. The market is very difficult to see whether the rise in the Friday session continues this week or not .

But there are different views on the gold price this week , experts said that gold trading volume will decrease , leading to a higher degree of price volatility . This week , Comex will close early on Tuesday and leave Wednesday 's Trading Christmas. Transactions will return to normal on Thursday .

Gold trading strategies of some trusted institutions - December 23, 2013

The price of gold fell to $ 1,186.50 / ounce last week but was able to recover the cost of $ 1,200.00 / ounce on 6th last night .

Walking to mitigate the Asian session

Increase of Europe

Reducing the U.S. session

The trading range : 1207 to 1192 .

Trading strategy :

Sales in 1205 / 07 , Stop loss 1211 target 1192 expectations .

NextVIEW - Business Strategy gold , oil and the day 23/12
Kitco - Gold Trading Strategy Day 23/12

Get up to 24 hours of trend :


The price of gold fell to $ 1,186.50 / ounce last week but was able to recover the cost of $ 1,200.00 / ounce on 6th last night .

This week , your body will revolve around the price of gold on the support area $ 1,180.00 / ounce , the gold price if this support is penetrated , the next resistance level is $ 1,100.00 turn / ounce and 1,050 , 00 USD / ounce . Conversely , if the gold price remains above $ 1,200.00 / ounce , the gold price may well come back up to the level of $ 1,300.00 / ounce and $ 1,400.00 / ounce .

Forex Yard - Gold Trading Strategy Day 23/12

The level of technical support

Resistance : 1245 -1227 - 1215

Current Price : 1201.9

Support levels: 1180 - 1167 - 1155

Pivot : 1225

The main strategy :

Sell ​​below 1225 target for the 1180-1167

Secondary strategy : If break 1215 targets for 1227-1245

Verdict : If 1225 was the resistance movement was downward prices .

Daily Remarkable news - December 20, 2013 (sources: collection)

BOJ NO MONETARY POLICY CHANGE

End of regular policy meeting today , Bank of Japan ( BOJ ) is committed to maintain the asset purchase program at 60-70 trillion yen per year ( equivalent to about 700 billion dollars ) . BOJ Governor Kuroda said Japan's inflation is currently at 1% and loose monetary policy will continue to be maintained until inflation reaches 2 % target .

According to Hideo Kumano , an economist at Dai- ichi Life Research Institute and a former BOJ official , the yen slid after cuts announced quantitative easing program by the Fed will support the sales tax increase Japan 's government in April next year .

However, the BOJ also said the impact of the consumption tax increase policy , the Japanese economy is expected to continue to recover at a moderate level and growth rate can be decreased after the tax increase was applied policy month of 4/2014 .

TOWARDS ESTABLISHING THE EUROPEAN UNION BANK

European leaders began a summit meeting lasts two days from yesterday (19 /12) for signing the coalition agreement the bank. It is expected that this will be a unique monitoring system for banks in the euro area and can provide financial support if needed .

Union Bank is considered necessary to restore the confidence of investors in the eurozone after that weak banks caused by the impact of the financial crisis .

WORLD GOLD PRICES DOWN THE LEAST 3 YEARS OF RELIGIOUS

Gold prices fell more than 30 USD in session yesterday and is now near its lowest level in the last 3 years shall be established in June . Experts said that this sharp decline is the result of gold from selling activities of investors after Fed QE3 announced cuts of $ 85 billion to $ 75 billion per month today 18/12 .

The gold price is currently facing pressure from all sides . Fed QE3 means cutting the amount of money pumped into the market was not as big as before , and this is a big disadvantage factor for gold . In addition, low inflation , a stronger dollar , the economic recovery and the stock market to the point that other factors caused investors no longer want to hold gold .

Today, the largest gold trust fund SPDR Gold Trust the world with a net sale of 3.9 tonnes of gold , while reducing the volume of 808.7 tons of gold holdings . From the beginning of next week now , this fund have been net sellers , with total sales up to 18.9 tonnes of gold .

Some experts said that , on the technical aspects of this sharp decline of gold is opening up opportunities for a rally . However , most analysts believe that gold prices will not have a positive outlook in the short term . With the key support level of 1.200 USD / ounce , the gold price fell further risk .

Gold trading strategies of some trusted institutions - December 20, 2013

Gold opened the U.S. session last night dropped to 1205.50 after the FOMC meeting , the Fed announced it would reduce bond purchase program to $ 75 billion . The metal is carried to its highest level in 1209 when the unemployment rate increases , and then the price fell to its lowest level in 1193 due to the strong dollar and global equities green points.


KITCO - gold day trading strategy 20/12

Modest increases the Asian session

Walking to the mitigation of Europe

Reducing the U.S. session

The trading range : 1197-1182

Trading strategy :

Sell ​​in 1197 , Stop loss 1202 target 1182 expectations .

Forex Yard - Gold Trading Strategy Day 20/12

Pivot : 1227

Key Strategy : Sell below 1227 target for the 1180-1167

Secondary strategy : If break 1227 targets for 1245-1268

Commentary: The short term trend is still very strong reduction and power reduction .

The level of technical support

Resistance : 1268 -1245 - 1227

Current Price : 1192.52

Support levels: 1180 - 1167 - 1155

ScotiaMocatta - Identify trend gold price date 20/12

Gold opened the U.S. session last night dropped to 1205.50 after the FOMC meeting , the Fed announced it would reduce bond purchase program to $ 75 billion . The metal is carried to its highest level in 1209 when the unemployment rate increases , and then the price fell to its lowest level in 1193 due to the strong dollar and global equities green points. Finally , the metal closed down 1194.75 .

Thus, gold has weakened to $ 1194 yesterday . This metal has the lowest break in July in 1208 , are paving the way for prices to bottom next critical in 1181 ( bottom of 6/28 ) . Price movements are very weak with the current pressure is driven by the pressure cycle last year . We believe that new lows in 2013 will be formed at 1155 , the 61.8 % Fibo fluctuations increased from 2008 to 2011 (ie from $ 682 to $ 1,920 ) .

Gold trading strategies of some trusted institutions - December 19, 2013

Gold opened the U.S. session last night at 1233 , then dropped to the lowest level by 1228.50 U.S. government debt fell after the housing data was very positive , rising to its highest level in nearly 6 years as of May 11/2013 . However, gold prices have increased again , to 1238.50 at the highest level and stable dollar adjustment at the end of the day and closed at 1235 .

KITCO - gold day trading strategy 19/12

Sideways Asian session

Modest increases of Europe

Reducing the U.S. session

The trading range expected : 1215-1235

Trading strategy :

Sell ​​below 1235 , target 1225 and 1215 . Stop loss above 1240 .

Forex Yard - Gold Trading Strategy Day 19/12

Pivot : 1250

Key Strategy : Sell below 1250 target for the 1212-1197

Secondary strategy : If break 1250 targets for 1268 -1279

Comment : The RSI is below 30

The level of technical support

Resistance : 1279 - 1268 -1250

Current Price : 1218.18

Support levels: 1212 - 1197 - 1180

ScotiaMocatta - Identify trend gold price date 19/12

Gold opened the U.S. session last night at 1233 , then dropped to the lowest level by 1228.50 U.S. government debt fell after the housing data was very positive , rising to its highest level in nearly 6 years as of May 11/2013 . However, gold prices have increased again , to 1238.50 at the highest level and stable dollar adjustment at the end of the day and closed at 1235 .

Choppy trading after the Federal Reserve announced a gradual withdrawal bond purchase program to 75 trillion in January 1/2014 .

Thus, gold has closed overnight rise in 1235 , but remained in sideways range for nearly 1 month . This makes the ADX trend indicator weakened considerably , from recent highs at 43.46 to $ 31.84 now . The bearish trend continues but the momentum has weakened . Therefore, the price of gold should move down here at the bottom of nearly 1210 new trend that intensified. If gold broke above the most recent high margin in 1268 is likely to appear round some short selling ( buying drum fill ) .

Daily Remarkable news - December 19, 2013 (sources: collection)

The Fed decided to cut QE PACKAGE

Ends policy meeting lasts two days 17 and 18/12 , the Fed announced cut -scale bond buying program monthly $ 10 billion from $ 85 billion currently applying to 75 billion USD. The implementation will start from January next year . Notify see , 9/10 voting members of the FOMC decision on their support .

Also in the announcement , the Fed said it would keep interest rates ultra- low 0-0.25 % until the unemployment rate hit 6.5 % and inflation remains below 2.5 % . Most FOMC members expect the first rate hike visits will take place in 2015.

FOMC members predict the unemployment rate will range from 6.3 - 6.6 % at the end of 2014 and 5.8 - 6.1 % at the end of 2015 , respectively lower than the official forecast which launched in September this 6.4 - 6.8 % and 5.9 - 6.2 % . According to the Fed , the unemployment rate will drop below 6 % in 2016 .

While inflation may fluctuate in the range of 1.4 % - 1.6 % in 2014, lower than previously estimated range of the Fed 's 1.3 % - 1.8 % . In 2015, this index will be at 1.5 % - 2 % before inching up about 1.7 % - 2 % in 2016 .

GOLD PRICE REDUCED AFTER THE FED

Gold fell 1 % to $ 1.218 / ounce in trading yesterday when the Fed announced downsizing of QE3 . Experts said that the decline in gold prices limited expectations suggests QE3 Fed cut was priced in gold before . On the other hand , the $ 10 billion cut is not too big to push gold prices from falling further .

Yesterday , the largest gold trust fund SPDR Gold Trust, the world continues to add 4.2 tonnes of gold net sales , decreased volume was 812.6 tons of gold holdings . In the past three sessions , this fund net sales with total sales up to 15 tons .

After the Fed's move to cut , analysts say , the scale quantitative easing program will gradually narrow in the near future and ending in 2014 . Gold prices are expected to remain under pressure .

Daily Remarkable news - December 18, 2013 (sources: collection)

MARKET awaiting the results of Fed meeting

Today the Federal Reserve monetary policy announcement after meeting his 2-day . This meeting of the Fed awaited by issue of concern is whether this market has cut the Fed quantitative easing program after the recent statistics show that the strong recovery of the U.S. economy especially the labor market .

One of the top concerns of the Fed is to limit the volatility of the market because of its policy decisions . Therefore, the president press conference held immediately after Bernanke Fed policy statement is also seen as very important by Bernanke explains Fed's decisions as well as provide policy direction in the future this agency .

Market watchers are predicting for the scenario will happen when the Fed ended the meeting. Perspective is the most market expectations that the Fed will maintain scale asset purchase program at $ 85 billion per month but clearly notice that the cuts will begin in early 2014 , will mean take place in January or March next year . Although the U.S. economy showing strong recovery in recent times , the more likely the Fed policymakers will wait for the next data to confirm that the current recovery is not sustainable temporarily . Besides, the current inflationary pressure is not big in November when U.S. inflation was only 1.2 % , much lower than the Fed's target of 2% . If this scenario happens , the dollar will likely decline slightly .

Another scenario is more likely to happen is that the Fed will undertake QE3 cuts , however only limited reductions in levels 5-10 billion and said the Fed's actions in the future depends into the next evolution of the U.S. economy . Average employment growth across U.S. 4 months exceeded 200,000 and the unemployment rate fell to 7 % allowing downsizing Bernanke stimulus simultaneously to open the possibility to increase or decrease the size of this program in the next term of the new president Yellen . If this scenario occurs , the market is likely to witness the rise of the dollar gains however the greenback's value will not be strong .

Financial markets can be volatile if the Fed's decision making investors by surprise. If the Fed does not cut as well as conduct not provide policy direction in the coming time, the dollar will decline sharply . In this case a sharp cut stimulus program to scale up to 15-20 billion dollars , the rise of strong greenback is unavoidable .

GOLD PRICE DEPENDING ON THE FED

Gold prices continued tension in the session yesterday as investors cautiously result of Fed policy meeting published today . The forecasts of analysts still leaning ability Fed will not cut the size of the quantitative easing program at this meeting . However, gold prices could reduce pressure if Fed cuts stimulus plan at the beginning of next year . In case the Fed announced downsizing of the stimulus package , the price of gold will face the risk of falling . Besides, a number of suggestions that gold prices will not fluctuate sharply once the decision was made ​​that the Fed did not surprise the market .

Gold trading strategies of some trusted institutions - December 18, 2013

Gold fell and before the U.S. session open at 1232.50 , and then progress to the highest level in 1243 when the fault of the U.S. CPI and stock still walked the red globe . Gold retreated to its lowest level in 1228 as investors moved cautiously into the FOMC meeting . Finally , the metal closed in 1230 .

KITCO gold - trading strategy 18/12

Sideways Asian session

Modest increases of Europe

Reducing the U.S. session

The trading range expected : 1220-1240

Trading strategy :

Sell ​​below 1240 target 1225 and 1220 . Stop loss above 1245 .

Forex Yard - Gold Trading Strategy Day 18/12

Pivot : 1250

Key Strategy : Sell below 1250 target for the 1223-1197

Secondary strategy : If break 1250 targets for 1268 -1279

Verdict : If you do not pass the milestone in 1250 , the risk remains high break below 1223

The level of technical support

Resistance : 1279 - 1268 -1250

Current Price : 1231

Support levels: 1223 - 1212 - 1197

ScotiaMocatta - Identify trend gold price date 18/12

Gold fell and before the U.S. session open at 1232.50 , and then progress to the highest level in 1243 when the fault of the U.S. CPI and stock still walked the red globe . Gold retreated to its lowest level in 1228 as investors moved cautiously into the FOMC meeting . Finally , the metal closed in 1230 .

Thus, gold stop at 1230 , continued to trade in sideways range . Support is at 1210 and resistance located bottom at the peak in 1268 . The bearish trend still exists , so the gold would risk retest important bottom in 1180 .

Daily Remarkable news - December 17, 2013 (sources: collection)

European single currency rose against the U.S. dollar in trading yesterday as reports showed the eurozone 's manufacturing sector continued to grow at the fastest rate in the past 31 months .

PMI manufacturing of euro zone published by Markit rose from 51.6 points to 52.7 points in November , higher than the median forecast of 51.9 points and is the highest level since May 5/2011 .

Germany 's manufacturing sector , a leading economic region maintain strong growth momentum with manufacturing PMI rose from 52.7 points to 54.2 points , higher than the 53.1 median forecast of analysts .

Eurozone PRODUCTION GROWTH CONTINUES

Although the service sector has slowed in December . However, the eurozone composite PMI maintained at 52.1 points , the highest since May 5/2011 .

GOLD PRICE moving sideways FED MEETING RESULTS

Gold price volatility in the trading session yesterday , but ended the day , gold prices rose only slightly over the closing price of the last trading week as investors still appeared hesitant in identifying the direction of the price gold results ahead of Fed policy meeting released tomorrow .

The recent rapid improvement in the U.S. labor market as the Fed increases the ability to decide to cut stimulus program in this session . However, most market observers expect the Fed to continue to maintain a QE3 package worth $ 85 billion per month .

Gold prices are forecast can continue walking until the Fed announcement of future quantitative easing program , factors to be considered the most important impact on the direction of gold prices in the near future.

Gold trading strategies of some trusted institutions - December 17, 2013

Gold opened the U.S. session to increase through 1237 . Then the bottom fell the day in 1234 when production data better than expected , then reversing up again to its highest level in 1252 due to weakening dollar and rising oil prices , leading up to the short-selling ( buying occupancy blank ) before Fed meeting . This metal under pressure at the end of the day and closed at 1244 .

KITCO - gold day trading strategy 17/12

Sideways Asian session

Modest increases of Europe

Slight increase U.S. session

The trading range expected : 1235-1250

Trading strategy :

Sell ​​below 1252 , target 1235 . Stop loss above 1258 .

Forex Yard - Gold Trading Strategy Day 17/12

Commentary: When there is resistance , the 1250 price changes also follow a downward trend

The level of technical support

Resistance : 1279 - 1268 -1250

Current Price : 1241.1

Support levels: 1212 - 1197 - 1180

The main strategy :

Sell ​​below 1250 target for the 1212-1197

Secondary strategy :

If break 1250 targets for 1268 -1279

ScotiaMocatta - Identify trend gold price date 17/12

Gold opened the U.S. session to increase through 1237 . Then the bottom fell the day in 1234 when production data better than expected , then reversing up again to its highest level in 1252 due to weakening dollar and rising oil prices , leading up to the short-selling ( buying occupancy blank ) before Fed meeting . This metal under pressure at the end of the day and closed at 1244 .

Thus, gold rose slightly yesterday , closing at 1244 , but still within the trading band of the 5th week . The metal traded mostly sideways since 21/11 , in the range of 1210 to support the resistance in 1268 . The trend is still in a bearish trend , gradually leaving oversold .

Gold trading strategies of some trusted institutions - December 16, 2013

Sell ​​below 1240 target 1225. Stop loss above 1245.

KITCO gold-trading strategy 12/16

Get 24 to nail trend:

Sideways Asian session

Modest increases of Europe

Reducing the U.S. session

The trading range expected: 1230-1250

Trading strategy:

Sell ​​below 1240 target 1225. Stop loss above 1245.

Forex Yard - Gold Trading Strategy Day 16/12

Pivot: 1250.00

Key Strategy: Sell below 1250, Target 1212-1197

Secondary strategy: Increase over 1250 calls for increased road 1268-1279

Trend: Decrease

Intraday Levels

Resistance: 1279 - 1268 - 1250

Support levels: 1212 - 1197 - 1180

Daily Remarkable news - December 16, 2013 (sources: collection)

MARKET WAITING FOMC meeting results
This week there is not much statistical significance of the U.S. economy published . The market's attention focused on the results of the last policy meeting of this year 's Open Market Committee Federal ( FOMC ) - the Fed's policymaking takes place on Tuesday and Wednesday this week .

The recent market performance shows that the Fed has the ability to cut program of quantitative easing at this meeting . November job growth was much higher than expected and the unemployment rate fell to 7 % showed the U.S. economy is recovering strongly . In addition, policy makers in the U.S. Congress has reached agreement fiscal year budget for 2014 and 2015 to prevent a government shut down again early next year .

However, most observers still hope the Fed will cut the packet delay QE until early next year for a few reasons . First, they want to make sure the growth is sustainable and not temporary . Second, inflation is still running at 1.1 % , lower than the 2 % target that the agency put out . Third, this is the end of the year and is also the end of Bernanke 's term president .

GOLD PRICE THIS WEEK : Depends on Fed

World gold prices rebounded 1 % in the last session of the week thanks to cheap hunting after two days of decline . However , analysts said the market remains vulnerable ahead of the crucial policy meeting the Fed's happening this week.

In opinion polls expert predicted gold prices this week by website Kitco News precious metals performed with 8/23 feedback predicted price increase , 9 reviews forecasted prices fell , and 6 the opinion that prices will move sideways. Participation in the weekly poll is gold trading companies , investment banks , commodity traders futures , fund managers and analysts technical charts .

Analysts expressed in the comments wondering gold prices this week by the direction of the price of the precious metal in the final months of 2013 is heavily dependent on the outcome of the Fed meeting . Although the agency expects to delay cuts quantitative easing program , many observers still believe that gold prices will remain under pressure when the agency determined reduction plan in January next year .

Daily Remarkable news - December 13, 2013 (sources: collection)

According to the U.S. Commerce Department , retail sales in November rose 0.7 % , higher than the forecast of 0.6 % and is the highest level in 5 months. Meanwhile , the proportion of votes in favor and 332 votes against 94 , the U.S. House easily passed the budget agreement for fiscal year 2014 and two in 2015 . The next step , should get the bill approved by the Senate would not have predicted obstacle .

USD yesterday continued to appreciate against most major currencies as retail sales in November rose sharply along with the lawmakers have reached an agreement on the budget increase speculation about the possibility of the Fed will soon implement measures to reduce speed stimulus program .
Retail sales in U.S. rose to the highest level 5 MONTHS


AUD fell sharply after central bank Governor Glenn Stevens in all Australian respondents reiterated his view that the currency of Australia needs more discounts to boost economic growth . Mr Stevens also said , in his opinion , is a reasonable threshold of 0.85 billion AUD / USD .

Dollar to its highest level in more than 5 years compared with JPY as the difference between the yield on U.S. Treasuries and Japanese government bonds expanded the most since April 2011 . In his interview with the Financial Times yesterday , the Governor of the Central Bank of Japan ( BOJ ) Haruhiko Kuroda said the BOJ will continue to implement economic stimulus package until stable inflation at 2% and will boost pump more money into the economy if inflation slows. The USD / JPY is expected to touch 105 levels in the near future.

World gold prices plummeted STRONG

World gold prices fell sharply in trading yesterday as U.S. economic statistics published positive than expected and it passed the House budget agreement , to prevent the risk of the U.S. government to close again market early next year that increased expectations about the possibility the Fed will soon cut QE3 quantitative easing .

End of session 12/12 , the world gold price down 26 cents or 2.1 % to $ 1.226 / ounce . Thus, in two sessions 11-12/12 days , gold prices have fallen about 37 USD / ounce . Currently gold is near the lowest level in 5 months on set last week .

In trading yesterday , the investment trust world's largest gold SPDR Gold Trust added 6 tons of gold net sales , decreased levels of 827.6 tonnes hold . In two recent decline in the price of gold , the SPDR Gold Trust, the net sales total of 8.1 tonnes of gold . From this year , the fund has sold more than 500 tonnes of gold , bringing the lowest hold down nearly 5 years .

Gold trading strategies of some trusted institutions - December 13, 2013

Gold dropped to 1235.50 U.S. session open after U.S. lawmakers reach budget deal is seen as the primary signal for the gradual withdrawal of Fed QE .
Forex Yard - Gold Trading Strategy Day 13/12

Pivot : 1250

Key Strategy : Sell below 1250 target for the 1212-1197

Secondary strategy : If break on 1250 targets for 1268 -1279

Comment : The RSI signals are reduced and also reduced the expected depth .

The level of technical support

Resistance : 1279 - 1268 -1250

Current Price : 1226.58

Support levels: 1212 - 1197 - 1180


ScotiaMocatta - Identify trend gold price date 13/12

Gold dropped to 1235.50 U.S. session open after U.S. lawmakers reach budget deal is seen as the primary signal for the gradual withdrawal of Fed QE .

The metal is gradually closing high sums up the day at 1237.50 before falling to its lowest level during the day at 1225.50 due to data of U.S. retail sales surged amid stronger greenback also despite rising unemployment . After all , this metal adjustment in the afternoon and ended in 1226 .

Thus, gold has closed the 2nd day in a row in 1226 . Motivation downward trend which had formed since early September has turned out , creating more pressure in the short term . Resistance at 1277 , according to the Fibo 61.8 % rise in July to August . Support is located at the most recent low in 1210 .

Daily Remarkable news - December 12, 2013 (sources: collection)

Congress reached agreement BUDGET

The policy makers of both Republicans and Democrats have reached an agreement on the budget . The draft budget if the government is bicameral U.S. Congress ends a stalemate over extending the negotiations and stop the risk of a government shut down again on 01/15/2014 and pause the fight budget .

However, this positive information reinforces the earlier decision to cut the program to buy bonds worth $ 85 billion / month on the following week's meeting of the U.S. Federal Reserve ( Fed ) after the data positive economic data have been published previously , particularly labor data published Friday .

USD Index, measuring the strength of the dollar rose for the first time after 5 consecutive days before it fell . Meanwhile, the yen rose against most major currencies as global stocks plunged sharply cut by Fed QE fears , increasing demand for haven assets .

GOLD PRICE REDUCED AFTER 3 consecutive days

Gold prices retreated back in session yesterday when MPs of the two parties in the U.S. Congress reached an agreement for funding the government after 1.15.2014 , the government blocked risk closure again . Fiscal instability was resolved to increase the expected Fed cuts soon quantitative easing program at its meeting next week . End of session 11/12 , world gold prices fell 10 USD to USD 1,251.80 / ounce .

The market's attention remains focused on the Fed's policy meeting held on to 17-18/12 . The prosperity of the labor market increases the agency expects to cut stimulus at the last meeting of the year . However, some analysts said the market has become less sensitive to speculation about the timing and pace of Fed QE package reduced and the price of gold can be volatile sideways in the remaining time of year when investors become more cautious , especially at the end of this year .

Gold trading strategies of some trusted institutions - December 12, 2013

Gold opened the U.S. session last night dropped to 1257.25 , then progress to the highest level in 1264 due to the short-selling ( buying drum fill ) while the euro remained near its highest level against the dollar 6 weeks .

KITCO - Gold Trading Strategy Day 12/12

Get up to 24 hours of trend :
Reduce the Asian session
Increase of Europe
Reduce slightly early U.S. session
The trading range expected : 1240-1260

Trading strategy :

Sell ​​below 1260 , Stop loss in 1265 , 1245 and 1240 objectives .

Forex Yard - Gold Trading Strategy Day 12/12

The level of technical support

Resistance : 1305 - 1294 - 1279

Current Price : 1254.08

Support levels: 1242 - 1226 - 1212

Pivot : 1242

The main strategy

Buy the 1242 targets for 1279-1294

Secondary strategy : If price break below the 1242 target of 1226-1212

Verdict : Despite adjustments may continue but will be within the limits .

ScotiaMocatta - Identify trend gold price date 12/12

Gold opened the U.S. session last night dropped to 1257.25 , then progress to the highest level in 1264 due to the short-selling ( buying drum fill ) while the euro remained near its highest level against the dollar 6 weeks . And then the price fell to its lowest level during the day at 1256.50 after temporary budget agreement in the U.S., this supports the expectation of a gradual withdrawal bond purchase program by the Fed . Finally , the metal closed at 1257 level .

Gold closed down 3 points after day continuous increase , going from the lowest level to the highest level in 1268 1210 . While prices on the daily chart trend is still down from its highest level in August ( 1433 ) , the negative signal has weakened to a point where we have moved from the capital to passing trend the other day . Negative trend indicator Negative Directional Movement is now at 20 , down from the high 34 most recently . Resistance is located at 1277 , with gains of 61.8 % by July and August . Support is the recent lows at 1210 .

Daily Remarkable news - December 11, 2013 (sources: collection)

MOVING CLOSER TO EUROPEAN UNION BANK AGREEMENT

European single currency rose yesterday to the highest level in the past 6 months against the dollar as European leaders are trying to come to an agreement on the establishment of mechanisms to protect solve common economic area .

At the meeting taking place in Brussels ( Belgium ) , the finance minister European Union is moving closer to the establishment of a banking union . This mechanism is designed to take on the responsibility to rescue the banking system in poor countries , one of the main causes of the financial crisis areas , by transferring the supervision of domestic financial sector it to the European level .

Meanwhile , forecasts of observers still leaning ability Fed cuts have not been quantitative easing program at its meeting next week while waiting for more bodies to confirm the trend data for U.S. economic recovery is sustainable . Reuters survey released on 9/12 showed most analysts think the Fed will delay cuts to stimulate March next year .

Gold price to the highest level within 3 weeks

Gold prices rose sharply and unexpectedly to the highest level in the past 3 weeks . Experts said that the sharp gains of gold last night as a result of international winter status of investors' short sales , technical buying and a weaker dollar . End of session 10/12 , the world gold price increased 1.7 % to $ 1.263 / ounce .

Investors shorting gold yesterday buying aggressively to realize profitability , risk hedging can occur when a meeting of Fed policy 17-18/12 day is approaching . Meanwhile , technical buying accelerated as gold to replicate the key resistance level of $ 1,250 / ounce .

Gold prices are still at risk of falling back if the Fed policymakers cut package conducting QE at its meeting next week . In contrast , precious metal prices will maintain rising momentum if the Fed's current policy is maintained for a while longer .

Gold trading strategies of some trusted institutions - December 11, 2013

Gold has moved up before the U.S. session open at 1258.50 , this is the lowest level of the day . Then mark the highest gold forward 3 weeks at 1268.50 through technical selling and buying Treasury up in front of the FOMC meeting next week .

KITCO - Gold Day Trading Strategy 11/12

Get up to 24 hours of trend :

Reduce the Asian session

Increase of Europe

Increased the close down U.S.

The trading range expected : 1252-1268

Trading strategy :

Buy over 1252 , Stop loss below 1248 , expect 1268 target .

Forex Yard - Gold Trading Strategy Day 11/12

The level of technical support

Resistance : 1305 - 1294 - 1279

Current Price : 1263.4

Support levels: 1242 - 1226 - 1212

Pivot : 1242

The main strategy

Buy the 1242 targets for 1279-1294

Secondary strategy : If price break below the 1242 target of 1226-1212

Comment : The RSI is supported by the increased sugar trenline .

ScotiaMocatta - Identify trend gold price date 11/12

scotiamocata Gold moved higher before the opening of U.S. session at 1258.50 , this is the lowest level of the day . Then mark the highest gold forward 3 weeks at 1268.50 through technical selling and buying Treasury up in front of the FOMC meeting next week . Finally , gold tapered and closed at 1262 level .

Gold has had a strong rally , breaking resistance in the stop band in 1258 to end at 1261 . This makes short -term outlook from bearish to sideways. MACD has generated a buy signal and the RSI is moving higher. Next resistance is at 1277 , according to the Fibo 61.8% rise from June to August . Support lies at recent low levels in 1210 .

Daily Remarkable news - December 10, 2013 (sources: collection)

RISK OF PROPERTY PRICES CONTINUE TO RISE

The trade surplus of China in November rose to the highest level in more than four years due to increased exports beat expectations helped China maintain the momentum of economic recovery . Data from the General Administration of Customs show that the country trade surplus rose to $ 33.8 billion as exports rose 12.7 % over the same period , and imports by 5.3 % .

The risk asset prices continued to rise in trading yesterday as positive signs from China along with positive U.S. data published last week and investors believe strongly in economic recovery global economy .

In this week no more important economic information is published . The market's attention directed at the Fed's meeting next week to monitor whether the agency has cut the stimulus or not .

Many analysts believe that the Fed will delay cutting program of quantitative easing in March next year for a few reasons . First, they want to make sure the growth is sustainable and not temporary . Second, inflation is still running at 1.1 % , lower than the 2 % target that the agency put out . Third, this is the end of the year and is also the end of Bernanke 's term president .

Reuters yesterday announced the survey forecast of specialists point cut by the Fed stimulus . Accordingly , only 9 out of 63 economists said the Fed will be asked to narrow the QE package at its meeting held on to 17-18/12 . 19 suggested that the Fed into action in January 1/2014 . The remainder said the Fed will delay to late March next year or more.

GOLD PRICES GOING UP WEEK SESSION

Gold prices rose in trading on Monday as investors expect the Fed not cut quantitative easing program at its meeting held on December this . According to a Reuters poll of economists published yesterday , many people predicted the Fed will cut QE3 in March next year . End of session 9/12 , the world gold price increased by 11 USD to USD 1,239.9 / ounce .

This week there is no more important economic information of the U.S. was announced , the price of gold is forecast to move sideways in the amplitude of the previous week as investors cautious ahead of Fed policy meeting held on to 17-18/12 . Although these forecasts are opinions of the ability to tilt the Fed will delay reducing stimulation until next year . However, reports last week showed a strong recovery of the U.S. labor market , therefore , does not exclude the possibility that the Fed QE package immediately cut this month .

Gold trading strategies of some trusted institutions - December 10, 2013

Gold opened at 1232.50 U.S. session last night , then fell to the lowest level at 1231.50 before climbing to the highest level in 1239 as the dollar weakened when uncertainty in phased program of bond purchases the Fed's monthly accounting advantage .

Forex Yard - Gold Trading Strategy Day 10/12

The level of technical support

Resistance : 1294 - 1279 - 1252

Current Price : 1239.9

Pivot : 1252

The main strategy

Sell ​​below 1252 target for the 1212-1194

Secondary strategy : If price break on 1252 targets for 1279-1294

Verdict : If price break the resistance movement in 1252 also slashed prices .

ScotiaMocatta - Identify trend gold price date 10/12

Gold opened at 1232.50 U.S. session last night , then fell to the lowest level at 1231.50 before climbing to the highest level in 1239 as the dollar weakened when uncertainty in phased program of bond purchases the Fed's monthly accounting advantage . After all , this metal selling pressure and closed in 1235 .

Thus, gold closed at stopping landmark in 1235 , this is the 2nd consecutive sessions . Resistance at 1240 , according to the Fibo 76.4 % margin in July and 8 , next resistance is 1258 , this is the highest level since the amplitude adjustment in the past few weeks . Support was lowest in 1180 .

The most recent price movements caused RSI bounced off 30th ( sometimes considered oversold ) , forward current levels 42 . However, real support for RSI is at 19.74 . MACD has generated a buy signal , though the general trend is still reduced but if break 1258 resistance , we will move to a neutral point .

Top 10 nations gold reserve

1. U.S

The amount of official gold reserve: 8,133.5 tonnes
The percentage of gold in total foreign exchange reserves: 75.6%
1952, the U.S. has the largest gold reserves in the world with 20,663 tonnes. For the first time this number falls below 10K is in 1968.

2. Germany

The amount of official gold reserve: 3,391.3 tonnes
The percentage of gold in total foreign exchange reserves: 72.7%.
Germany has sold gold under CBGA1 and 2 for the purpose of casting coins. In the first year of CBGA3 (2008-2009), the Bundesbank has sold approximately 6 tonnes and 4.7 tonnes of gold sold from the date of 7/12/2011. To date, there is no change in the gold reserves of Germany, however, the Bundesbank said in January they're summoning all the physical gold in Paris and the Fed, New York.

3. Italy

The amount of official gold reserve: 2,451.8 tonnes
The percentage of gold in total foreign exchange reserves: 72.2%
Italy did not sell any gold bullion since CBGA1 to CBGA3 CBGA2 while it did not mention information related to gold. However, in 2011, it was reported that the central bank has bought gold to and improve its balance sheet before the inspection capacity.

4. France

The amount of official gold reserve: 2,435.4 tonnes
The percentage of gold in total foreign exchange reserves: 9.2%
France has sold 572 tonnes of gold in CBGA2 period, then also sold about 17 tons to the Bank for International Settlements in late 2004, part of a stock purchase BIS. France can not comment on plans to sell gold under CBGA3.

5. China

The amount of official gold reserve: 1,054.1 tonnes
The percentage of gold in total foreign exchange reserves: 1.7%

As can be seen, gold still accounts for a relatively small portion of the total U.S. $ 3.2 trillion foreign exchange reserves of China. This is a modest figure if placed next milestone an average of 10% of the world.

Building gold stocks are hot issue in the context of China's national ambitions to internationalize its currency-Financial Times said.

6. Switzerland

The amount of official gold reserve: 1,040.1 tonnes
The percentage of gold in total foreign exchange reserves: 10.5%
According to the World Gold Council, in 1997 in this draft mentioned the sale of a portion of gold in reserves because they no longer consider "the necessity of monetary policy purposes" anymore.
1,300 tons of gold is considered to be too much and the country started selling out in 5/2000. Then, 1,170 tonnes were sold under CBGA1 and 130 tons were sold during the period CBGA2. Switzerland is also not available for comment on the sale of gold in the time taken CBGA3.

7. Russia

Official gold reserves: 969.9 tonnes
The percentage of gold in total foreign exchange reserves: 9.8%

Russia has set a target of collecting gold from 2006 to diversify its foreign exchange reserves as well as its foundation for the ruble to become an international reserve currency. Last year, Russia has bought 75 tonnes, most of the gold ever mined in the country.

8. Japan

Official gold reserves: 765.2 tonnes
The percentage of gold in total foreign exchange reserves: 3.2%.
In 1960, the gold reserves of Japan with only modest little figure 6 tons. However, a sharp jump occurred in 1959 and since then, the reserves of the country are higher, typically buying tons in 2012 to 169 this year.
In 2011, Japan's central bank sold gold to collect 20 trillion yen to reassure functioning economy in the aftermath of the earthquake, tsunami and nuclear.

9. Netherlands:

Official gold reserves: 612.5 tonnes
The percentage of gold in total foreign exchange reserves: 59.2%.
In 1999, the Netherlands adopted the Treaty of central bank gold (CBGA1), which allows to sell 300 tonnes of gold within 5 years later. However, they only sold 235 tons.
Time CBGA2 (2004/2005 - '08 / '09), the Bank has sold a total of 165 tons (including 65 tons of residues from CBGA1). However, under CBGA3 (2008/2009 - '13 / '14), they will not sell a certain amount of gold.

10. India:

Official gold reserves: 557.7 tonnes
The percentage of gold in total foreign exchange reserves: 9.9%
India's central bank is said to have bought the IMF gold and gold is always considered safe investments although rarely comment on his purchase collection. Meanwhile, the government is also trying to limit people buy gold because that is the source of gold imports attack caused the national budget deficit.

Official gold reserves: 557.7 tonnes
The percentage of gold in total foreign exchange reserves: 9.9%

India's central bank is said to have bought the IMF gold and gold is always considered safe investments although rarely comment on his purchase collection. Meanwhile, the government is also trying to limit people buy gold because that is the source of gold imports attack caused the national budget deficit.
T3 moving average - indicator

T3 moving average, the indicator created by Tim Tillson is tripple smoothed combination of EMA (Exponential Moving Average) and DEMA (Double and Triple Exponential Moving Average).

It's one of the popular and useful indicator, it's used in many trading system indicate the trends, or apply method in oscillator indicators to indicate the momentum of the trends.

         The fomula is:

         GD(N,v) = (1-v)*EMA[N] + v*DEMA[N]

         <=> GD(N,v) = EMA[N] + v * (EMA[N] - EMAofEMA[N])

         T3(N,v) = GD(N,v) of GD(N,v) of GD(N,v)

N : period of calculation.

v : volume factor, it controls  how much of the DEMA is used. you can see the DEMA fomula and download it by click at here. If v = 0 that means T3 is a Trippled EMA ( EMA of EMA of EMA), if v=1 that means T3 is a Trippled DEMA ( DEMA of DEMA of DEMA). Default v = 0.7, you can adjust it from 0 to 1.

You can see it in this chart below:

you can get T3 moving average in here, and many oscillator indicators using this method:

Candle sticks cycle - 5 Sakata Methods

5 Sakata Methods:


Five Sakata methods is a part of Sokyu Honma's method, it's the way to explain the structures or phase of the market like elliott wave method.

This theory explains the market base on five elements:
1. San Zan means three mountains and is the tripple tops
2. San Zen means three rivers and is the tripple bottoms
3. San Ku means the tripple gaps and refer to the empty intervals between the prices
4. San pei means three lines and refer to a countinuously ascending trend that is compose of three time/price units
5. San poh means three rest and refer to corrective movement within a trend that is made up of three time/price units.

These elements can be showed as a circle in this image below :

Source: refering willey's candlesticks book. you can find more information in his book.

Eliott wave - Trend line forecasting

Eliott wave - Trend line forecasting

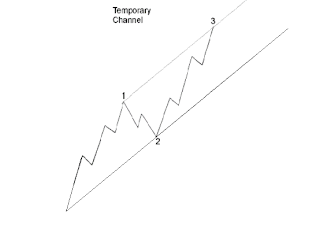
Using Paralell trend channel is one of the accuracy methods on elliott wave forecasting technique. Elliott noted that paralell trend channels typically mark the upper and lower boundaries of the impulsive wave. The analyst should draw them in advance to assist to determining the target and provide clues to the future developments of the trend.

To draw the channels we need at least 3 reference points. 

To predict wave 3 target, draw the line from peak of wave 1 paralells the trend line drawing from the bottom of wave 1 and peak of wave 2.

To predict wave 5 target, draw the line from peak of wave 3 paralells the trend line drawing from the peak of wave 2 and peak of wave 4.


The Elliott wave rules - corrective waves

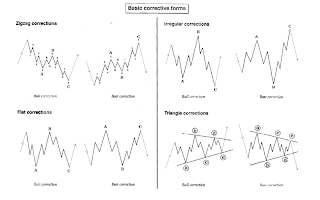
Corrective waves is the movement against the trend ( consolidation or letter phases). It is more difficult to identify than the motive wave because the corrective waves have more variations. The complexity of corrective waves can increase or decrease without warning, so the extend and depth of corrective waves are less pridictable than impulse waves.

 Corrective wave basic patterns:

Basic forms: Zigzag (5-3-5), flat (3-3-5), irregulars(3-3-5) and  triangles(3-3-3-3-3).


Complex forms: double threes and tripple threes ( this corrective forms can be subdivided into 4 categories: zigzag complex, flat complex, irregular complex).

Double threes patterns:


Tripple threes patterns:

Quote from: Balan_Robert's elliott waves book.

The Elliott wave rules - Motive waves

The motive waves:

It's the pattern of the five wave, wave 2 corrects wave 1, wave 4 corrects wave 3. The sequence of wave 1 to wave 5 is corrected by the a b c sequence.
- The rules of impule wave:
  + Wave 1 can be the impulse wave, or leading diagonal triangle pattern.
  + Wave 2 cannot retrace past the beginning of the wave 1.
  + Wave 3 must be the impulse wave.
  + Wave 3 cannot be the shortest wave of three impulse wave (1,3,5). It is almost the longest wave.
  + Wave 4 cannot overlap the pick of wave 1.
  + Wave 2 and wave 4 must have the alternations (scale of price or the patterns).
  + Wave 5 can be the impulse wave or diagonal triangle pattern.


The extentions:

    The extentions are the elongated impulse waves with exaggerated subdivisions. It only appears on one of the impulse waves. Most extensions occur in the 3rd wave.


The truncations:

   The truncations is the situation that the 5th wave cannot move beyond the end of the 3rd wave. It often occurs following the strong extension of the 3rd wave.
The ending triangle ( 3-3-3-3-3)

   The ending triangle is the special type of motive wave, not yet the impulse wave. It take a wedge shape pattern with two converging lines, with each subwave subdividing into 3 wave.
You can see it in the image below:

The leading triangle (5-3-5-3-5)

   The leading triangle pattern is a special type of motive waves too, but the structure is not the same with the ending triangle. The 1st, 3rd, 5th wave of the leading triangle subdivide into 5 wave.


Basic Elliott wave theory- essential concepts

Introducing:
Ralph Nelson Elliott (1871–1948), a professional accountant, discovered the underlying social principles and developed the analytical tools in the 1930s. He published his theory of market behavior in the book The Wave Principle in 1938, summarized it in a series of articles in Financial World magazine in 1939.
The wave principle is dicovery that social or crowd, behavior trends and reverses in recognizable patterns. Using stock market data as his main research tool, Elliott discovered that the ever-changing path of stock market prices reveals a structural design that in turn reflects a basic harmony found in nature.

Until now, the Elliott wave theory is still one of the famous forcasting tools of the price movements. At now, one of the best research about elliott wave you can refer detail on "Elliott wave principle" Robert Prechter's books, search it on google.
The analysing system of elliott wave base on the wave patterns he discovered, at first we must understand the structure and the rules of the waves:

The five wave pattern, and the cycle:

The movement of the prices take the form of five waves of specific structure; Three waves of them, which are labeled 1,3,5 called impulse or motive wave, it indicates the direction of the trend, they are seperated by 2 countertrend interruptions, which are labelled 2 and 4, called corrective wave ( partial retracement).
"R.N. Elliott did not specifically state that there is only one overriding form, the "five wave" pattern, but that is undeniably the case. At any time, the market may be identified as being somewhere in the basic five wave pattern at the largest degree of trend. Because the five wave pattern is the overriding form of market progress, all other patterns are subsumed by it." - cited in Robert Prechter' book.

The rythm of five wave up and three wave down makes the complete cycle of eight waves. '1,2,3,4,5' is motive phase, and 'a,b,c' is corrective phase. Every wave can be subdivided to smaller wave, the image below will illustrate the cycle:


The wave degree can be subdevided into: grand cycle, supercyle, cycle, primary, intermediate, minor, minute, minuette.

Next post will introduce some basic rules of each wave types

Demark pivot point, support and resistance level

Another way to identify the support and resistance you can use Demark pivot points. It was created by the Tom Demark, he is one of the famous technical analyst, you can find many information about him on the internet.
Here is the formula:

The value of X in the formula below depends on where the Close of the market is.

If Close < Open then X = (H + (L * 2) + C)
If Close > Open then X = ((H * 2) + L + C)
If Close = Open then X = (H + L + (C * 2))

R1 = X / 2 - L
PP = X / 4 (this is not an official DeMark number but merely a reference point based on the calculation of X)
S1 = X / 2 - H


You can get the indicator in here: Demarkpivotpoint.mq4

Popular Posts

Loading...
Forex indicators and strategies Forex Tips - Forex Hints, Fx News, Daily Market Analysis