T3 moving average - indicator

T3 moving average, the indicator created by Tim Tillson is tripple smoothed combination of EMA (Exponential Moving Average) and DEMA (Double and Triple Exponential Moving Average).

It's one of the popular and useful indicator, it's used in many trading system indicate the trends, or apply method in oscillator indicators to indicate the momentum of the trends.

         The fomula is:

         GD(N,v) = (1-v)*EMA[N] + v*DEMA[N]

         <=> GD(N,v) = EMA[N] + v * (EMA[N] - EMAofEMA[N])

         T3(N,v) = GD(N,v) of GD(N,v) of GD(N,v)

N : period of calculation.

v : volume factor, it controls  how much of the DEMA is used. you can see the DEMA fomula and download it by click at here. If v = 0 that means T3 is a Trippled EMA ( EMA of EMA of EMA), if v=1 that means T3 is a Trippled DEMA ( DEMA of DEMA of DEMA). Default v = 0.7, you can adjust it from 0 to 1.

You can see it in this chart below:

you can get T3 moving average in here, and many oscillator indicators using this method:

Candle sticks cycle - 5 Sakata Methods

5 Sakata Methods:


Five Sakata methods is a part of Sokyu Honma's method, it's the way to explain the structures or phase of the market like elliott wave method.

This theory explains the market base on five elements:
1. San Zan means three mountains and is the tripple tops
2. San Zen means three rivers and is the tripple bottoms
3. San Ku means the tripple gaps and refer to the empty intervals between the prices
4. San pei means three lines and refer to a countinuously ascending trend that is compose of three time/price units
5. San poh means three rest and refer to corrective movement within a trend that is made up of three time/price units.

These elements can be showed as a circle in this image below :

Source: refering willey's candlesticks book. you can find more information in his book.

Eliott wave - Trend line forecasting

Eliott wave - Trend line forecasting

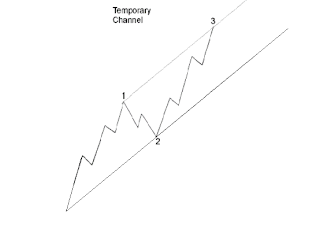
Using Paralell trend channel is one of the accuracy methods on elliott wave forecasting technique. Elliott noted that paralell trend channels typically mark the upper and lower boundaries of the impulsive wave. The analyst should draw them in advance to assist to determining the target and provide clues to the future developments of the trend.

To draw the channels we need at least 3 reference points. 

To predict wave 3 target, draw the line from peak of wave 1 paralells the trend line drawing from the bottom of wave 1 and peak of wave 2.

To predict wave 5 target, draw the line from peak of wave 3 paralells the trend line drawing from the peak of wave 2 and peak of wave 4.


The Elliott wave rules - corrective waves

Corrective waves is the movement against the trend ( consolidation or letter phases). It is more difficult to identify than the motive wave because the corrective waves have more variations. The complexity of corrective waves can increase or decrease without warning, so the extend and depth of corrective waves are less pridictable than impulse waves.

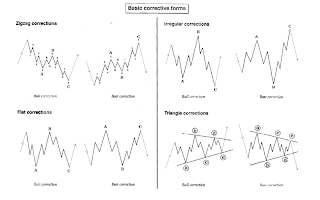
 Corrective wave basic patterns:

Basic forms: Zigzag (5-3-5), flat (3-3-5), irregulars(3-3-5) and  triangles(3-3-3-3-3).


Complex forms: double threes and tripple threes ( this corrective forms can be subdivided into 4 categories: zigzag complex, flat complex, irregular complex).

Double threes patterns:


Tripple threes patterns:

Quote from: Balan_Robert's elliott waves book.

Popular Posts

Loading...
Forex indicators and strategies Forex Tips - Forex Hints, Fx News, Daily Market Analysis